
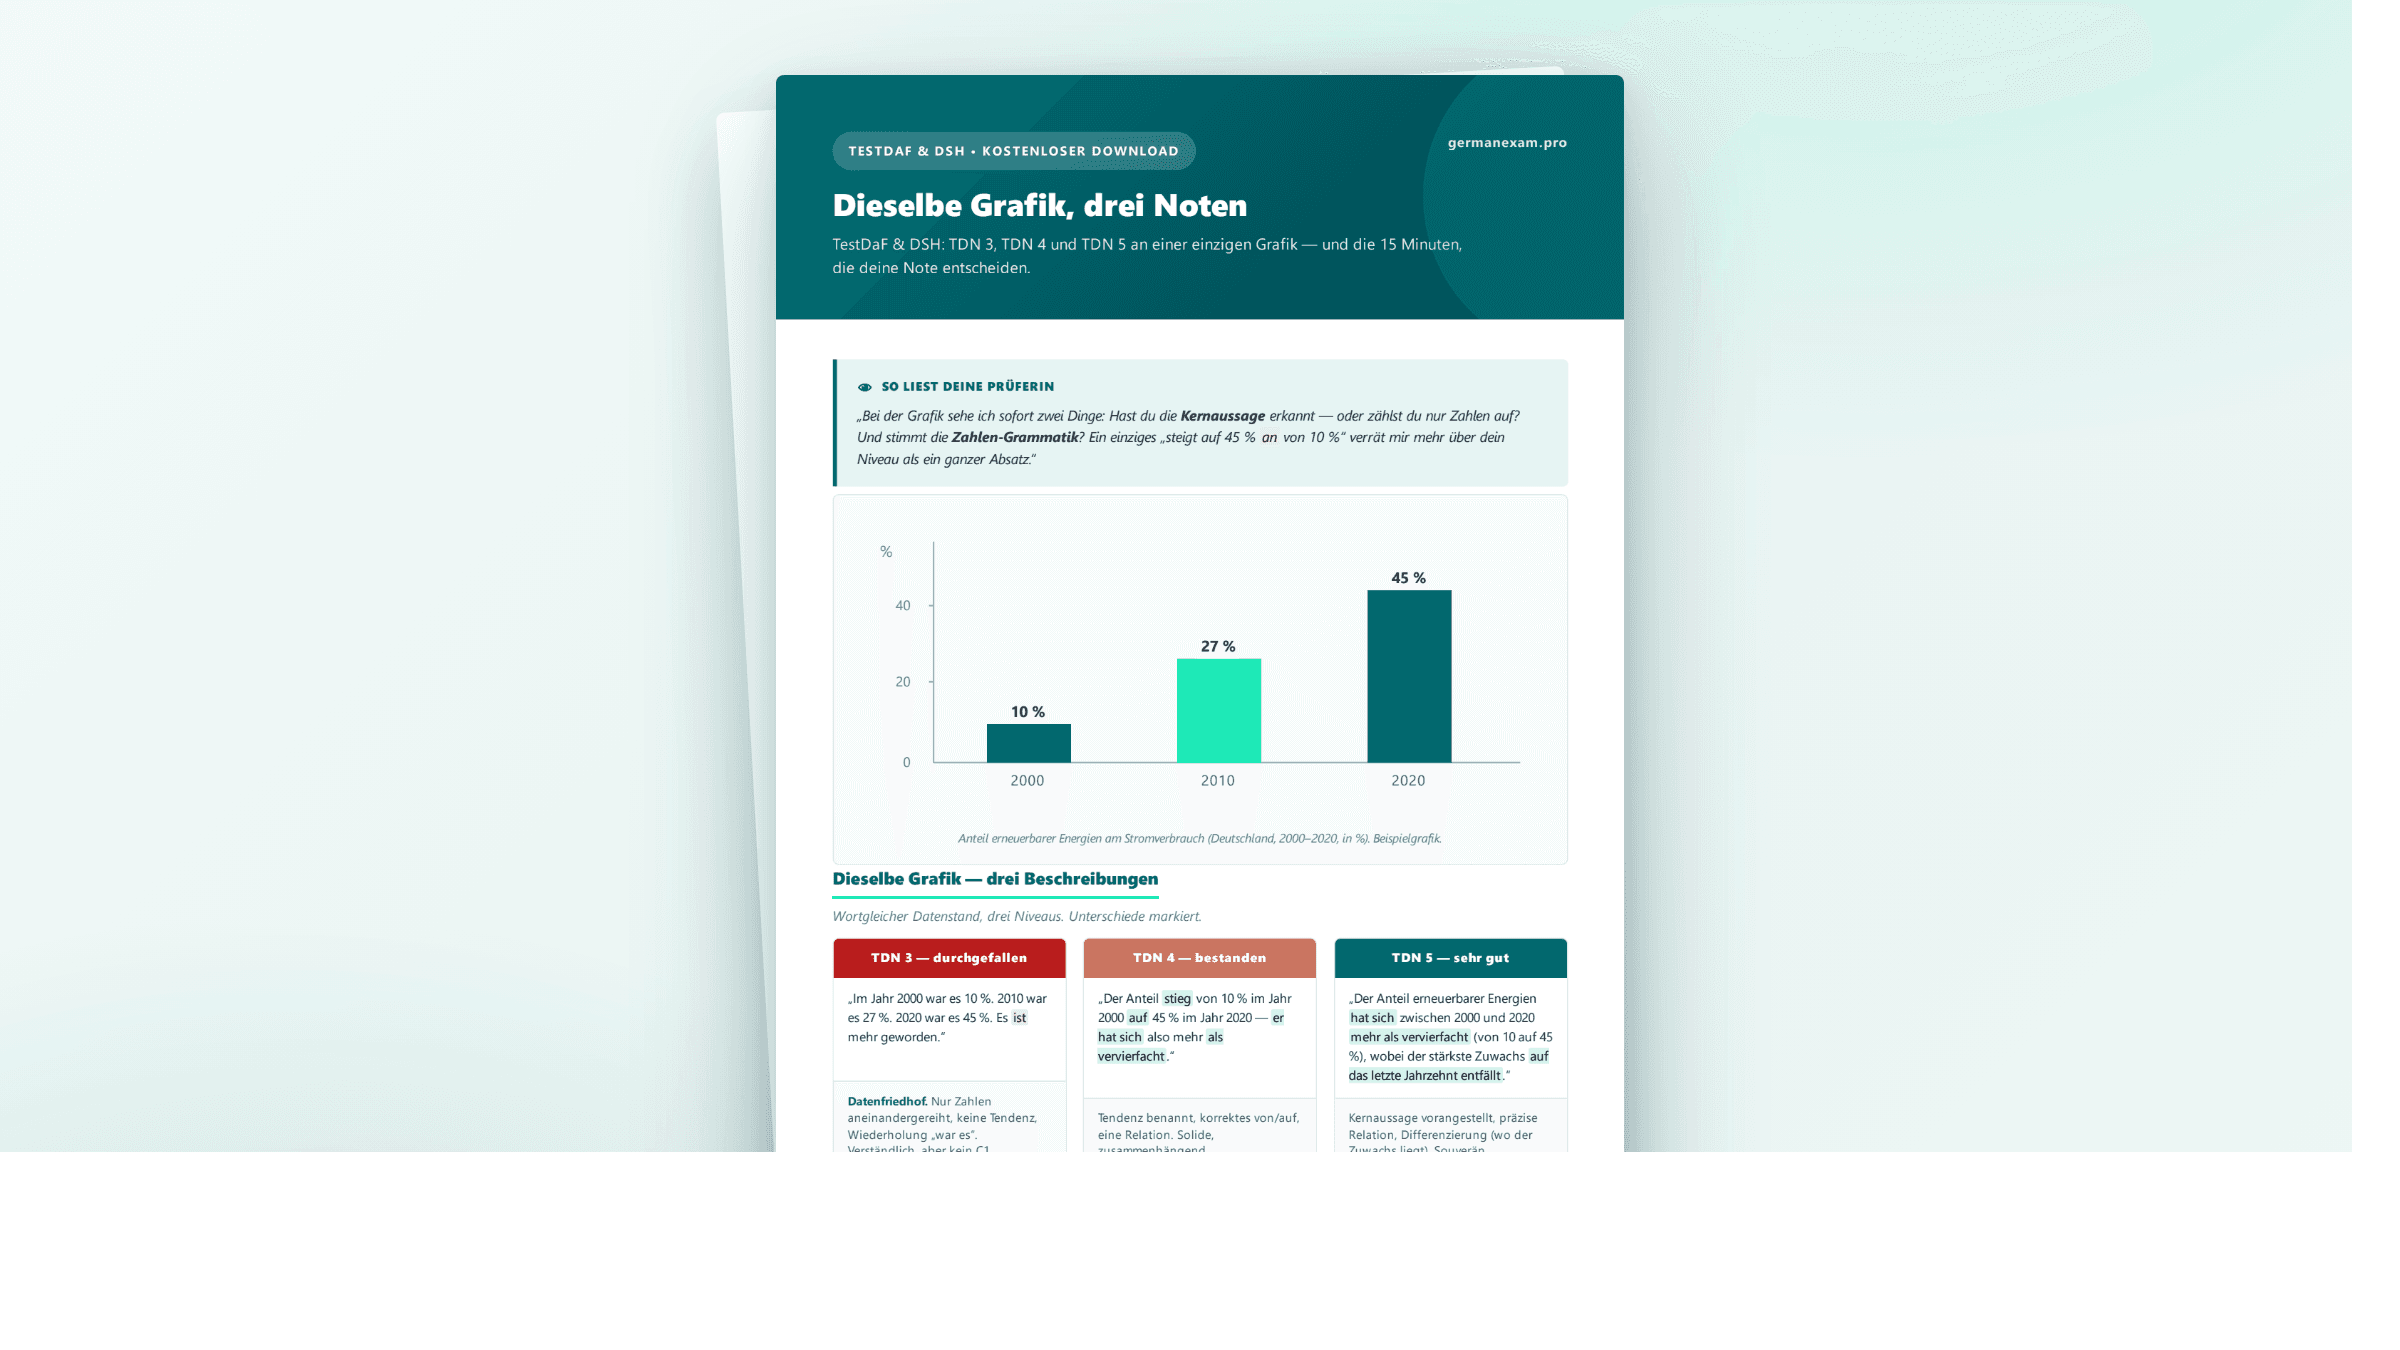
Graph description: same graph, three grades
TDN 3, 4 and 5 on one graph — plus the number grammar that gets noticed.
Need feedback on your text?
Send your text to our AI exam agent and get an honest assessment with improvement suggestions in 30 seconds.
What's Inside
- The same graph at TDN 3, 4 and 5 side by side — differences highlighted
- The number-grammar mistakes that get noticed (von/auf/um, percentage point) — with a price tag
- A direct path to the Prüfungs-Agent for your own graph
Frequently Asked Questions
Do I really have to describe a graph in TestDaF?
In the paper-based TestDaF, yes — the graph description is a fixed part of the writing task. Otherwise this applies only to the DSH; telc C1 (a discursive essay) and Goethe C1 (a forum post) require no graph. The key: don't describe every number, describe the main trends — otherwise you get a "data graveyard".
Which graph-description mistakes cost points?
Above all number grammar: confusing "von … auf …", equating percent with percentage points, or building "rise/fall" incorrectly. Such errors pull down the accuracy criterion. Listing every figure instead of interpreting the trend, by contrast, costs you on task fulfilment.
What separates TDN 4 from TDN 5 in TestDaF writing?
At TDN 4 the text is largely clear but stalls in places; at TDN 5 the examiner reads without stumbling, with broad vocabulary and secure sentence construction. In points, TDN 4 sits in the 10–15 range, TDN 5 at 16–20 of 20. What matters is less freedom from errors than consistent comprehensibility and range.
No account needed. Available instantly.
Ready for real exam feedback?
Our AI analyzes your texts using real exam criteria. Try it free.